
Opening Analysis / Round 1 / Round 2 / Round 3 / Final
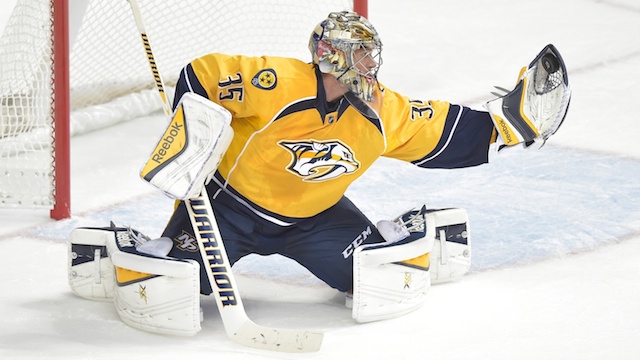 |
| Pekka Rinne might be the first NHL goaltender to score two assists and a shutout in the same game. |
For a moment, it looked like this year's pool could have had one of the most devastating first round knockout rates, but an early shocker with Chicago going down in four straight did not extend to the rest of the round. Washington was challenged but ultimately prevailed. In the end, the Blackhawks - co-favourites along with the Capitals - were the only team in the top five of player picks to be eliminated.
That said, we had 43% of the pool knocked out, a shade lower than last year but still the 6th highest in 19 years. Just over 1,000 picks were eliminated along with more than 100 Cup picks.
Individually, Chicago's loss of 23.5% of all picks is the second-most impactful first-round knockout, behind Washington's 2010 loss (25%) and just ahead of Pittsburgh 2012 (23.4%). But in terms of the sheer futility of their picks, it is a different story. More on that below.
Congratulations to Campbell Clark-Smith on taking first-round honours. Campbell took the lead early and padded it on Cam Talbot's shutouts, then hung on as the race tightened up. Pasqi Porco had a great second week to land in second, two points back while Matt Steeves is in third. Paul Martin and Shane Kozlowich round out the top five, with only a five point difference between first and fifth.
Up for the challenge are two poolies who didn't lose any players in round one. Reuben-Apollo Jackaman-Slipacoff, the longest name in the pool, sits in 8th with 9 players remaining while Glenn Zyzanski also has a full roster, one point back of Reuben-Apollo in 11th. They are the only two in the top 20 with 9 players, and only two more - Pasqi in 2nd and Kamerni Pillay have 7 players; the rest have 6 (or a few have fewer). This bodes well for the rest of the leaderboard that they can maintain their position.
See whether you are projected to rise or fall, and where you would rank after round 2 if everything else were the same, in our projections below.
Chicago's playoff failure can be described a lot of ways. First conference leader to be swept in round one since 1993 when Chicago was again the victim. Not the first pool leaders to go down in the opener, but the first to be swept. 2010 Washington was a bad scene in terms of expectations and players eliminated, and 2012 Pittsburgh came close. But what makes this so notable is the utter lack of scoring.
Only three goals in a four-game series is the third-lowest ever: in 2003 Minnesota scored only one goal against Anaheim but it was the conference finals, and Minny's players turned in a fine performance until then. The 2002 Flyers scored two goals in their first-round series against Ottawa (technically a five-game series), earning them the biggest bust award as a team. But neither of those teams had the sheer number of picks that Chicago had.
So without further ado let's examine a new pool statistic: average points per pick.
| Most Points/Pick | Fewest Points/Pick |
| Year | Team | Picks | Entries | % of Pool | Pts/Pick |
| 2009 | Pittsburgh | 176 | 185 | 10.6 | 29.04 |
| 2001 | New Jersey | 98 | 40 | 27.2 | 23.64 |
| 2010 | Chicago | 283 | 197 | 16 | 23.26 |
| 2008 | Pittsburgh | 353 | 189 | 20.8 | 22.48 |
| 2011 | Vancouver | 452 | 205 | 24.5 | 22.45 |
|
| Year | Team | Picks | Entries | % of Pool | Pts/Pick |
| 2017 | Chicago | 578 | 273 | 23.5 | 1.37 |
| 2010 | Detroit | 133 | 67 | 22.1 | 1.68 |
| 2016 | Los Angeles | 281 | 261 | 12 | 2.18 |
| 1998 | Philadelphia | 15 | 16 | 10.4 | 2.40 |
| 1998 | New Jersey | 22 | 16 | 15.3 | 2.82 |
|
Best and worst team performances, points per pick (min 10% of pool)
The 2010 Red Wings are the only team that came close to Chicago's futility - in a pool one quarter the size - and that was with six goals scored in the series. Fortunately for Chicago, two of their three goals (and four assists) were collected by the team's stars, or else this stat might have been a lot worse than the meagre 1.37 points per pick they achieved.
Unlike last year's near-record-high, this year we have a near-record-low after round one, with both the first and last-place entries recording just one point more than the lowest ever. Campbell Clark-Smith's leading entry has 54 points, one more than the 2007 leader's 53. Other than the 2010 high of 78 and last year's 73, all other first round leaders have had between 53 and 63 points. On the flip side, the 15 points received by our last place entry is only one more than the record low 14 set in 2013.
With all the downers being discussed, we should focus for a moment on the good in this year's playoffs. Evgeni Malkin quietly had 11 points in 5 games for Pittsburgh to lead all forwards. Other Penguins joined him near the top, as did Ottawa players. Erik Karlsson is in a class by himself on defense, his 6 points double that of any other defender picked int he pool. And in net, two shutouts each by Pekka Rinne and Cam Talbot have Nashville and Edmonton in the hunt in the West.
Only 10 entries were unscathed this year and still have all nine players. This suggests that there is still a level playing field for round 2 as people picked not only Chicago (217 entries) but also a mix of underdog teams that went down. Five entries were completely wiped out in round 1 this year, the same as last year and second-most behind only the 26 recorded in 2012.
Patrick Kane had 197 picks and very high expectations, even more than the rest of his team. So with only two points, the pool's leading pick is out and is deserving of this year's Biggest Bust award. (One could argue for a team-wide Biggest Bust such as the 2002 Flyers, but that was its own thing of beauty.)
Biggest busts over the years: 2016 - Doughty; 2015 - Pietrangelo; 2014 - Krejci; 2013 - Ovechkin; 2012 - Luongo; 2011 - Backstrom; 2010 - Brodeur; 2009 - Nabokov; 2008 - Brodeur; 2007 - Kariya; 2006 - Lidstrom; 2004 - Brodeur; 2003 - Joseph; 2002 - Entire Flyers roster (ok ok: Roenick); 2001 - Yzerman; 2000 - Gonchar; 1999 - Yashin; 1998 - Holik.
Congratulations are always due to individuals who take daring picks that pan out. This year we have a few picks in this category that will continue into round 2. Pekka Rinne (Nas) is the best one-pick-only in years, with 16 points and counting for Matt Steeves. Ottawa Senators Derick Brassard (9 points, Connor Johnson) and Bobby Ryan (8 points, Ron Wener) have both surprised while rookie Jake Guentzel (6 points, Laura Tackaberry) came out of nowhere on a stacked Pittsburgh roster. The best player nobody took was Shea Theodore (Ana, 5 points).
Major players on their way out: Kane, Chi, 197 picks; Keith, Chi, 142; Panarin, Chi, 98; Toews, Chi, 78; Burns, San, 55; Weber, Mon, 46; Pacioretty, Mon, 43; Crawford, Chi, 42; Marchand, Bos, 35; Price, Mon, 31.
My record in round one was a pretty good 6 for 8, and I was happy to get the Ottawa pick wrong. This round I'll guess against Ottawa again (and hope I'm wrong). As for Washington, they never make it past round 2, especially against nemesis Pittsburgh. Picks: Pittsburgh, Rangers, Edmonton, Nashville.
| Top Players |
| Forwards |
Team |
Pts |
Picks |
| Evgeni Malkin |
PIT |
11 |
47 |
| Derick Brassard |
OTT |
8 |
1 |
| Phil Kessel |
PIT |
8 |
34 |
| Bobby Ryan |
OTT |
7 |
1 |
| Alexander Radulov |
MON |
7 |
13 |
| T.J. Oshie |
WAS |
7 |
19 |
| Sidney Crosby |
PIT |
7 |
114 |
| Jake Guentzel |
PIT |
6 |
1 |
| Ryan Johansen |
NAS |
6 |
3 |
| Justin Williams |
WAS |
6 |
4 |
| Nicklas Backstrom |
WAS |
6 |
163 |
|
|
|
|
|
| Defense |
Team |
Pts |
Picks |
| Erik Karlsson |
OTT |
6 |
43 |
| Shea Theodore |
ANA |
5 |
0 |
| Morgan Reilly |
TOR |
5 |
3 |
| Kevin Bieksa |
ANA |
4 |
0 |
| Ryan Ellis |
NAS |
4 |
0 |
| T.J. Brodie |
CGY |
4 |
1 |
|
|
|
|
| Goalies |
Team |
Pts |
Picks |
| Pekka Rinne |
NAS |
16 |
1 |
| Cam Talbot |
EDM |
15 |
15 |
| Craig Anderson |
OTT |
9 |
2 |
| Henrik Lundqvist |
NYR |
9 |
6 |
|
| Teams |
| IN |
Picks |
Cups |
| Washington |
553 |
117 |
| Edmonton |
274 |
9 |
| Pittsburgh |
253 |
28 |
| Anaheim |
156 |
7 |
| Ottawa |
67 |
1 |
| St. Louis |
43 |
3 |
| NY Rangers |
34 |
3 |
| Nashville |
18 |
0 |
|
| OUT |
Picks |
Cups |
| Chicago |
578 |
72 |
| Montreal |
147 |
16 |
| San Jose |
93 |
2 |
| Boston |
75 |
3 |
| Minnesota |
66 |
7 |
| Toronto |
40 |
3 |
| Columbus |
34 |
1 |
| Calgary |
26 |
0 |
|
Here are the projected scores and rankings for after round
2. The projection assumes (wrongly, of course) that the remaining players will produce in round 2 at the exact same rate as in round 1. For example, Pekka Rinne would get another two shutouts and two assists, while Matt Murray would get zero for not playing.
LOST=Players Lost in Round 1
IMP=Impact (pts. by lost players)
IMP%=Impact as % of total pts.
|